Extracting Metrics From TeamCity
TeamCity is a java based build management and continuous Integration server from JetBrains. Very often , we will have to extract various metrics from TeamCity for tracking and trend analysis. TeamCity provides versatile api for extracting various metrics which can then be manipulated or interpreted as we need.
Below are basic api calls which can be used for extracting mertics. Please note that TeamCity api is powerful enough to do much more than extraction of data. However, for this blog post, I am focussing on metrics extraction part alone. All of these are GET request to TeamCity api with a valid user credentials ( use any id/password which can access TeamCity)
- Get List of Projects - http://teamcityURL:9999/app/rest/projects
- Get details of a project - http://teamcityURL:9999/app/rest/projects/(projectlocator) Project locator can be either “id:projectID” or “name:projectName”
- Get List of Build configuration - http://teamcityURL:9999/app/rest/buildTypes
- Get List of Build configuration for a project- http://teamcityURL:9999/app/rest/projects/(projectLocator)buildTypes
- Get List of Build - http://teamcityURL:9999/app/rest/builds/?locator=(buildLocator)
- Get details of a specific Build - http://teamcityURL:9999/app/rest/builds/(buildLocator) Build locator can be “id:BuildId” or “number:buildNumber” Or a combination of these like “id:BuildId,number:buildNumber,dimension3:dimensionvalue”. We can use various different values for these dimension. Details can be found in TeamCity documentation
- Get List of tests in a build - http://teamcityURL:9999/app/rest/testOccurrences?locator=build:(buildLocator)
- Get individual test history - http://teamcityURL:9999/app/rest/testOccurrences?locator=test:(testLocator)
Recently I created a Nodejs program to extract below metrics by chaining some of the above api calls.
- Number of builds between any two given dates and their status
- Details of number of test cases and their status , pass percentage, fail percentage etc for each build
- Details as above for entire period.
- Trend of test progress, build failures etc between those dates
- Create an output JSON with cumulative counts of passed/failed/ignored builds, passed/failed/ignored test cases , percentage of sucessful builds, frequency of pull request and their success rates etc.
Automate Accessibility Testing Using aXe
What is Accessibility testing ?
It is a kind of testing performed to ensure application under test is usable by people with disabilities. One of the most common accessibility testing for web applications is to ensure it is easily usable by people with vision impairment. They normally use screen readers to read the screen and use key board to navigate.
Web Content Accessibility Guideline (WCAG) list down guidelines and rules for creating accessible website. There are various browser extensions and developer tools available for scanning web pages to find out obvious accessibility issues. aXe is one of the widely used extension. Details of aXe can be found here. Once browser extension is installed, you can analyze any web page to find out accessibility issues. They also have a javascript API for aXe core .
I recently came across axe-selenium-csharp , which is a .NET wrapper around aXe. It is relatively very easy to setup and use. Below are the steps
- Install Globant.Selenium.Axe nuget package for solution. This will add reference to dll
- Import namespace using Globant.Selenium.Axe
- Call “Analyze” method to run accessibility check on the current page.
1 2 3 4 5 6 7 8 9 10 11 12 13 14 15 | |
Automated accessibility testing is NOT a completely foolproof solution. We will still require someone to scan the page using screen reader software later. But this will help to move accessibility testing to left and have more frequent runs and reduce the need for regression.
Mountebank - Adding Delay to Response
In previous blog post, I have explained about how to create a json response in mountebank. You can read about that here and here. Recently , I had to test a scenario about what will happen to application if downstream API response is delayed for some time . Let us have a look about how we can use mountebank to simulate this scenario.
Mountebank supports adding latency to response by adding a behaviour. You can read about that here . Let us try to implement the wait behaviour in one of the previous examples . This is a slight modification of the files used as part of examples mentioned here and here. You can clone my github repo and look at “ExamplesForWaitBehaviour” for the files.
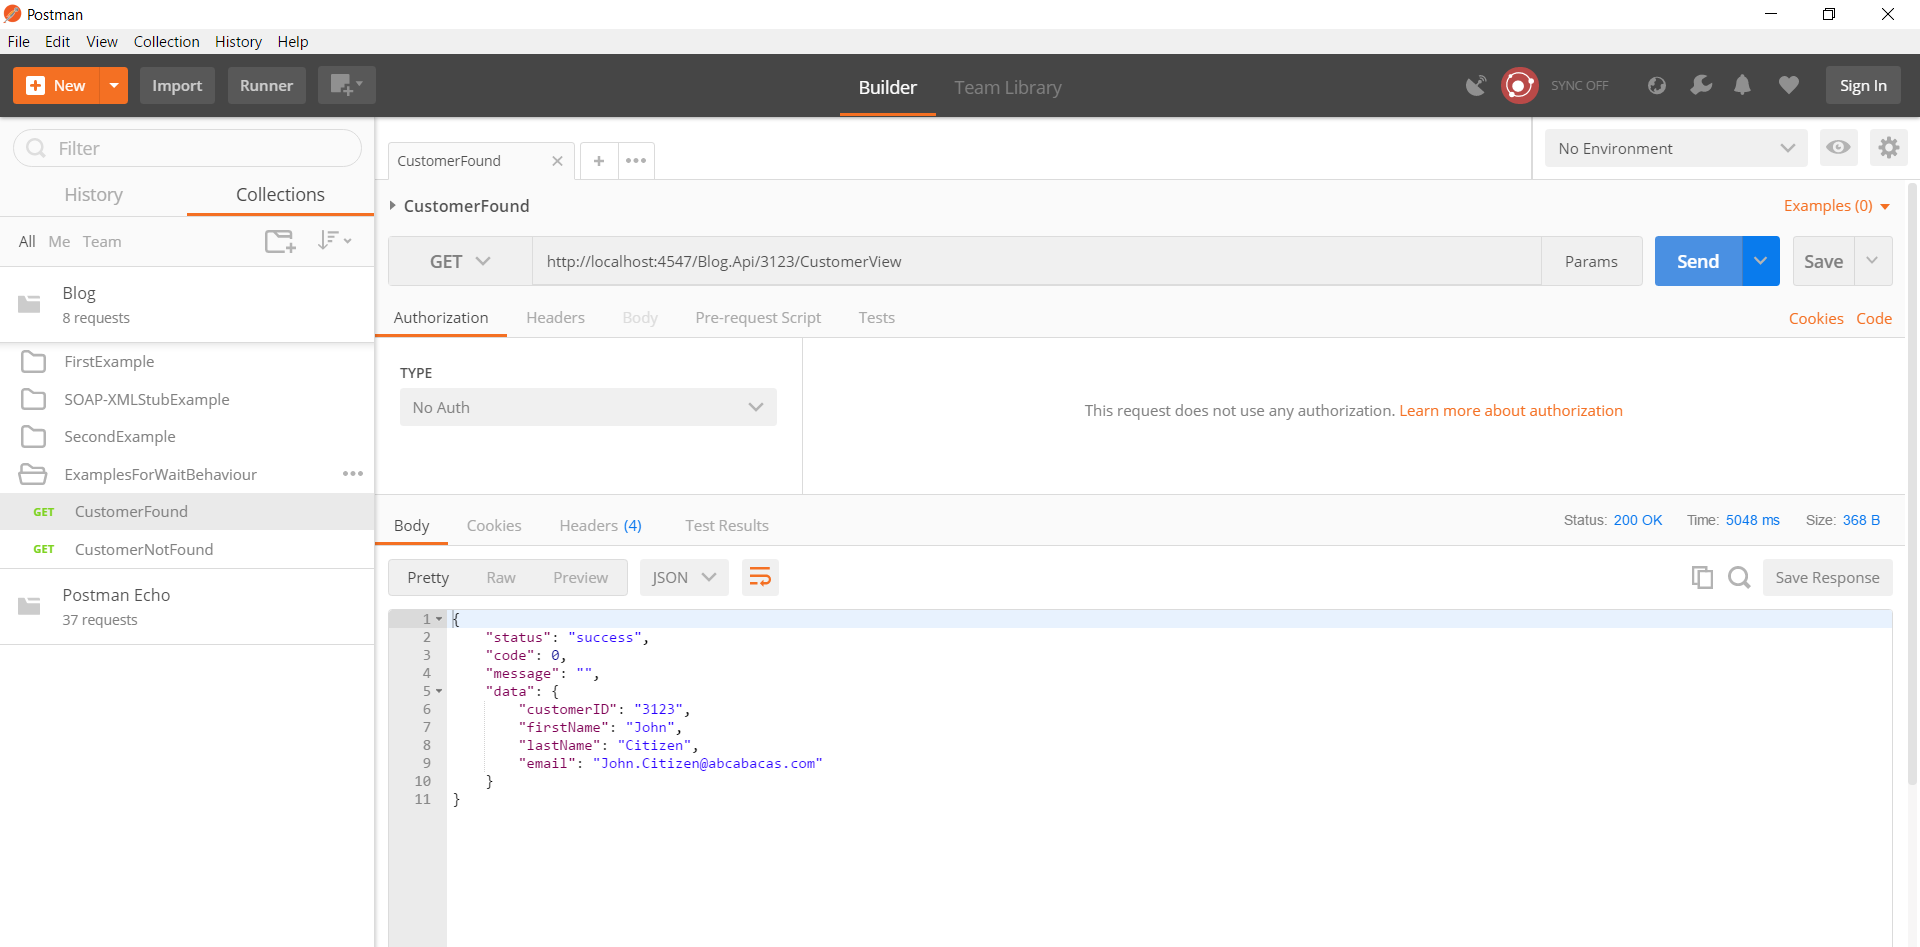
The only change which we need is to add a behavior to the response. This is added in “CustomerFound.json” file. After injecting file, we need to add behavior for waiting 5000 milliseconds.
1 2 3 4 5 6 7 8 9 10 11 12 13 14 15 16 17 | |
Now run Mountebank. If you are using the GitHub repo, you can do this by running RunMounteBankStubsWithExampleForWait.bat file. Else run below command inside the directory where mountebank is available. If needed, modify the path to Imposter.ejs as required.
1
| |
When we trigger a request via postman, we will get a response after specified delay + time for getting a response. Have a look at response time in below screenshot. Response time is more than 5000 ms.
Highlights of Past One Month
I was not active in this blog over past one month due to multiple reasons - both personal and professional. Following are some highlights over past one month.
ISTQB Test Automation Engineer
As mentioned in previous post, I had a chance to attend ANZTB SIGiST conference in August 2017. There were some good talks about various certifications offered by ISTQB/ANZTB. ISTQB Test Automation Engineer was one among them. I decided to give that a try . Spend some time over past one month to prepare based on the syllabus and I gave it a shot. Fortunately, I passed the exam with good marks
Traffic to blog
I had an interesting observation when I looked into google analytics for the blog. The traffic to this blog has grown over ten times compared to previous months. I analyzed the data and found that my blog and github repo for mountebank examples are mentioned in mountebank website. This resulted in having more traffic to the blog. I hope others are also benefitted from my experience with mountebank and the tutorial which I have in this blog. Hopefully, this will give me the motivation to write more.
Taking Emotions Out of Sprint Retrospective
An agile retrospective is a meeting held at end of a sprint to analyse their ways of working over past sprint and identify how to become more effective and then adjust accordingly. This is a ritual which belongs to team and criticism is given for facts/output and not for people. Retrospective creates an environment where the team feels safe and comfortable, which will allow them to talk freely about their thoughts and let go their frustration.
As an agile team, our team was pretty matured. Everyone knows what to do and what not to do. They come with solutions for most of the impediments faced during the sprint . Even then, there will be few issues which are still not resolved. Often retrospective meetings end up being a place for the team to let out their frustration rather than focusing on identifying what worked well and what could have been done better. Also action items coming out of discussion may be already tried out during sprint and was not working as expected.
Last week, I had a chance to run retrospective for the team. I wanted to focus more on proactive actions taken by the team while dealing with impediments. I decided to run a different retro in which I tried to keep emotions out and focus more on facts.
Goals of this retrospective
Hope below exercise will help to achieve :
- Take emotions out of discussion and focus on facts
- Review the actions taken by team during sprint and asses its effectiveness
- Identify improvements which were not tried out during sprint
How to do it
Sprint Goals
- First step is to identify the sprint goals and write it down on board for everyone to see. This reminds the team about their every day work to achieve the goals.
Negatives
- Next step is to identify the risk, issues and blockers which prevented the team from achieving it. It can be anything which team found as an impediment.
- Each team member has to write down a unique impediment on a card. Hence for a team of 10 members, you will have 10 unique impediments.
- Team will then rate the impediments on a scale of 1 - 10. Where 1 being least and 10 is a complete blocker.
- Once that is done, cards are exchanged with team members.
Positives
- Next person will then have to think about what all good ideas happened for impediment on their card ( written by someone else). It can be anything which team has tried to overcome the blockers, any innovative ideas tried out, usage of extra time for learning and development etc. Team members are free to discuss this with others to find out all positives of that issue.
- Once it is written, team member will rate it on a scale of 1 - 10. On practical world, the rating for positives will be less than the rating for negatives. Else, it will not be an impediment to start with.
Actions
- Now facilitator has to collect back all cards and look for three cards having a maximum difference between negative and positive ratings.
- By end of this, team will have three pressing impediments which they could not overcome in the sprint. It takes into account of all pro-active actions taken by the team while dealing with that specific impediments. It is also based on facts and collective feedback .
- Now it is time to discuss and come up with action items. Obviously new action items coming out of discussion should be new and was not tried earlier.
Setting Right Expectation About Benefits of Test Automation
Today I had a discussion with a project manager about stake holder expectations about value delivered from regression test automation and how to manage stake holder expectation. The discussion soon spanned on to challenges in automating manual test cases and candidates for automation testing.
Expectation Vs Reality
Management Stakeholders always visualize test automation as a silver bullet for fixing all pain points.They envision automation tests to be quicker, cheaper and effective in identifying all defects. Automation test cases are expected to be run on a button click and with 100% pass rate (except for valid bugs). Needless to say, that expectation is about having complete test coverage for automation scripts. Thinking is always geared towards reducing manual testers based on automation progress rather than having focus on improved quality of final product, faster time to market etc.
The ground reality is different from above expectation. Automated test cases are only as good as how you script it to be. Automated checks will alert tester about problems that checks have been programmed to detect.It ignores all other problems outside of it. Cost, speed, and ROI will depend on the tool used and complexity of tests implemented. Having an automated test is not a replacement for doing exploratory test manually. We need to cater for manual exploratory testing since automated scripts can only do verification of already known check points( for which the coding is done) and miss out check points which are not automated. In other words, test automation frees up tester’s time to focus more on exploratory testing which adds value.
Challenge in this specific case is to automate E2E manual regression test cases which are not existing. The testers are supposed to identify the regression test cases first by going to through existing application and then automate them. The expectation is that testers will identify all possible error scenarios and incorporate corresponding checks in automated scripts. This is going to be time consuming and expensive. It depends on domain knowledge of the person who creates automation test cases. There are chances that all existing bugs will be considered as an expected behaviour. More over the end to end test cases done at UI level is generally time consuming to develop, slow to execute and heavily depended on UI which makes it brittle.
Testing Pyramid
Solution to improve quality of a product is to follow the testing pyramid and try to automate more at lower levels instead of focussing at E2E level. This also has to be done while the product/software is developed.
Below is a modified version of testing pyramid.
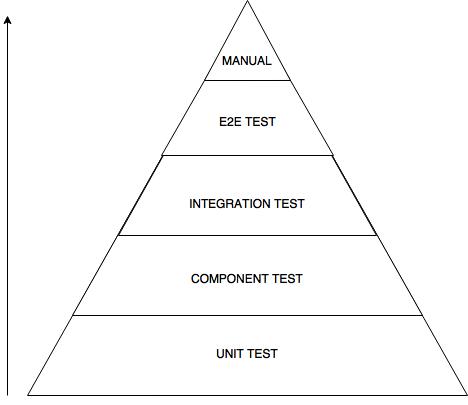
As you can see above, more emphasis is given to have automated test at Unit test level, followed by component level, integration test level, and finally E2E level through UI. It is relatively cheaper to implement automated test at the base of the pyramid and will get more expensive as we go up. Similarly, unit tests are faster to run, it can isolate issues immediately and are more stable. These characteristics will change adversely as we go up in test pyramid.
As obvious, it is not feasible to achieve this for an already existing system without having a significant investment in people, time and tools. This will impact ROI. Depending on situations, there is no right or wrong way to do test automation. Having something is always better than nothing. Hence when there is a need to automate regression test cases, it normally starts from the top. Significant investment is needed upfront to identify all critical regression test cases and corresponding validation that should be performed by automated tests. It is not feasible to automate all test or to have 100% coverage. Success rates of automation script run will depend on various factors like test data, environment stability etc. Everyone should understand that we are automating check point verifications and hence it does trigger alerts only for the checks which it is programmed to do. E2E regression through UI should be only a minimal subset of what is covered through other levels. We should be ready to invest in maintaining the automation assets over a period of time.
In this case, stakeholder expectation needs to be carefully managed. It is important to set right expectation about benefits offered by test automation for a successful project delivery. Automation testing can deliver benefits over a long period of time , provided proper planning was done upfront to automate at different levels of testing. Instead of considering it as solution for all pain points, we need to clearly articulate /set expectation about its limitations and long term benefits.
ANZTB SIGiST Conference
Today, I had a chance to attend SIGiST conference organised by ANZTB. It was a 2-hour session which includes a presentation, discussion, and networking opportunities. Being a first-time attendee to SIGiST, I was not sure what surprise I may have. Overall it was a fruitful session and I had a chance to meet people from other organisation and to understand what is happening at their end.
Today’s presentation was about “Test Automation – What YOU need to know”. Over all, it was a good session even though I found the presentation is more geared towards uplifting manual testers and what steps they should take to stay relevant in today’s world. Going by crowd surrounding presenters after the session, it seems topic was well received and resonated with most of the people in the room. But those who have experience in automation / performance testing will find it basic. The presentation is expected to be uploaded here in few days.
The topic for discussion was “Carriers in Testing”. This was really engaging and people participated actively sharing their experiences in career progression, experience in getting jobs etc. There was pretty lengthy discussion about how to make your resume stand out in the crowd, importance of certification, soft skill, analyticall and debugging skills and how to market yourself. Few recruiters/managers shed thoughts on what they look in prospective employee’s resume and how they short list candidates for interview.
Postman - Using Data File
One of the common requirement for automated testing is to run same test case against multiple test data. Luckily postman supports this by providing facility to use data files. This is available only when we run through postman collection runner or newman.
For this example, let us take a free public API http://services.groupkt.com/country/get/iso2code/AU . This API will return the name of the country depending on the 2 digit code passed. Let us assume that, we need to test this API with multiple country codes. For eg: AU, IN, GB etc. Let us take a look to see how this can be achieved using postman data files.
Environment file
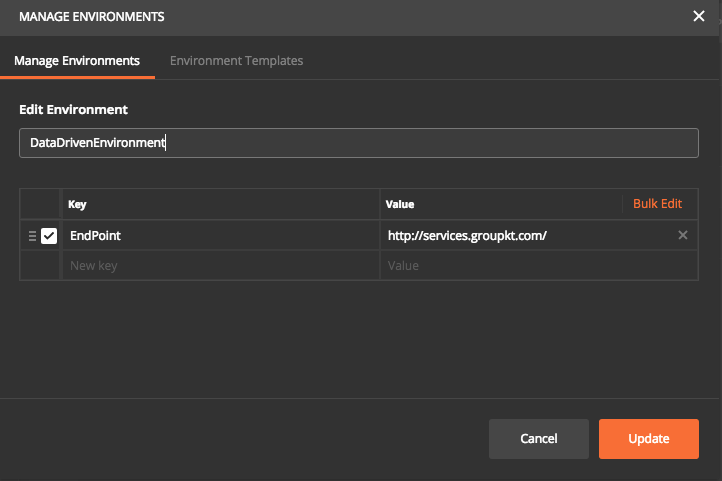
First, create an enviornment Manage Environment option at top right. Create an entry for endpoint as below.
Create Collection
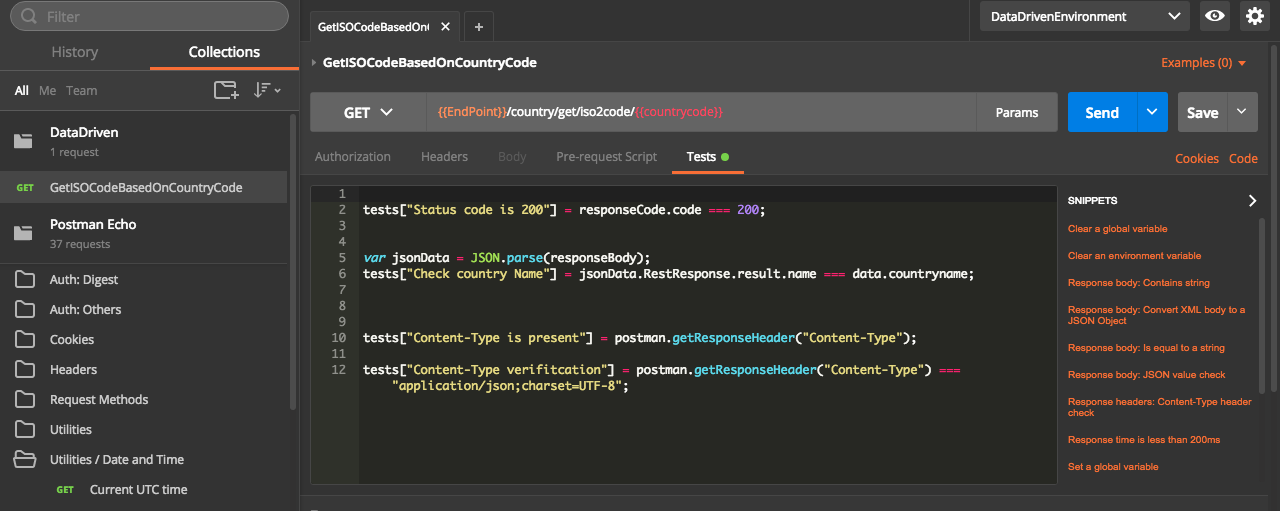
Next step is to create a collection with a GET request and write tests to verify the response. GET request used here is {EndPoint}/country/get/iso2code/{countrycode}
Endpoint is defined in environment file and countrycode will be in data file
Now write some tests to check the results. The data coming from data file will be available under “data” dictionary ( similar to global/environment variable. It can be accessed as data.VARIABLENAME or data["VARIABLENAME"] in both test and pre requisite scripts. Below screenshot shows the test which is for validating country name based on the data file.
DateFile
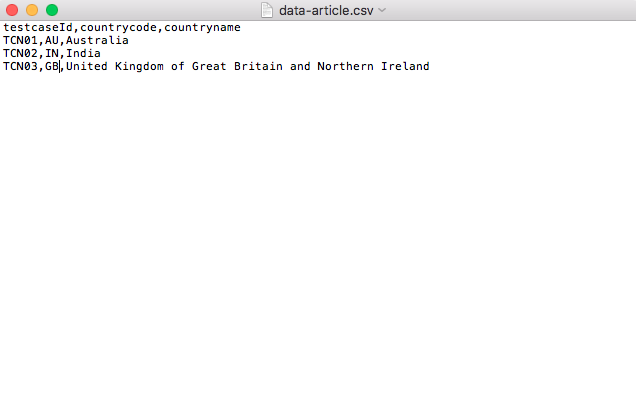
Postman supports both CSV and JSON format. For CSV files, the first row should be the variable names as the header. All subsequent rows are data row. JSON file should be an array of the keyvalue pair where the variable name is the key.
Data file used in this example is below. It has 3 column, where the first column is test case ID and the second one is country code which is used in the request and the third one is the country name, which is used for asserting the response received. In this example, I am looking for 3 different country codes.
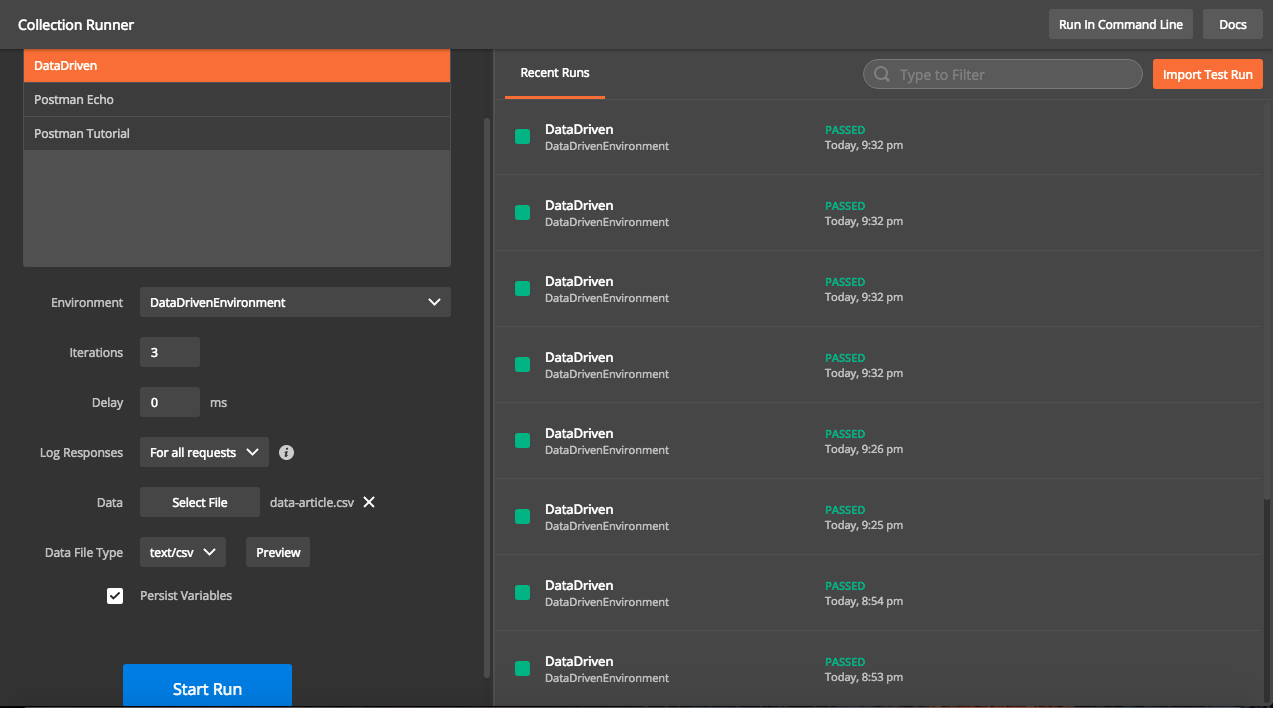
Running Collections
While running collections, we need to specify below inputs.
- Collection Name
- Environment file
- Data File
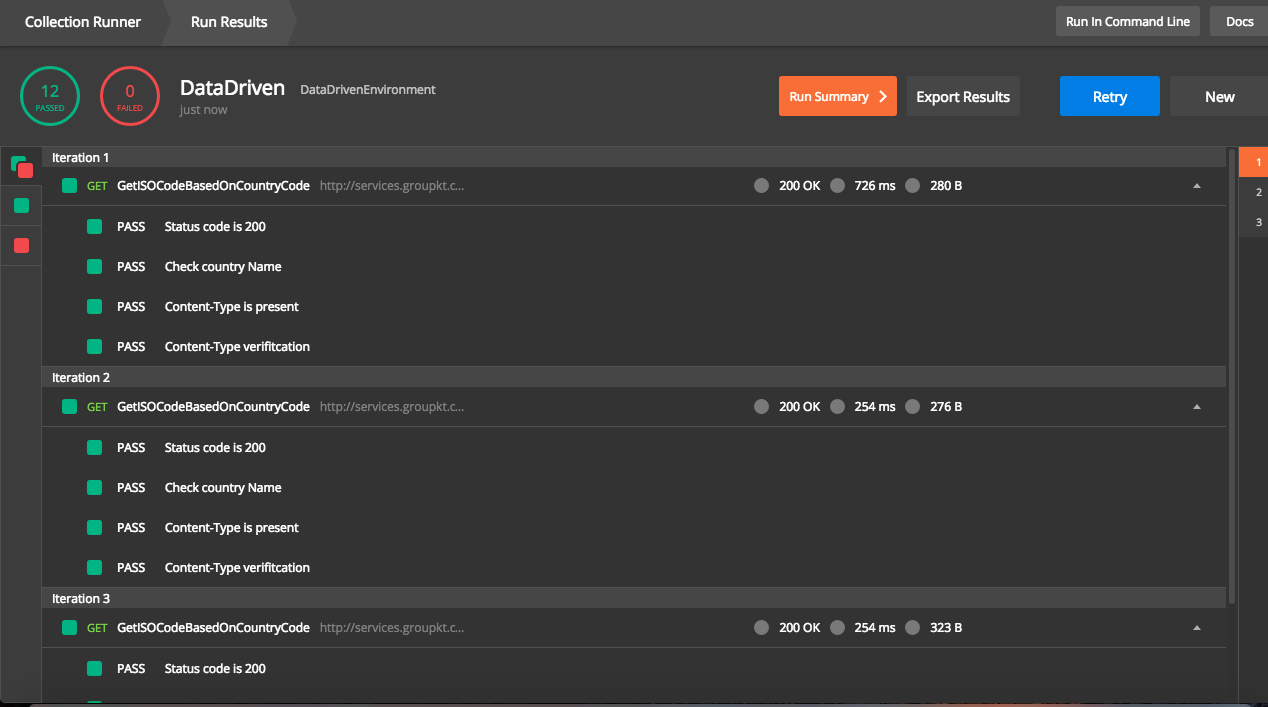
Depending on number of records in the data file, iterations will be auto populated. The results will also show the details for each iteration using the data. Details of response can be found by expanding response body
Running through Newman
We can run same collection through Newman as well
1
| |
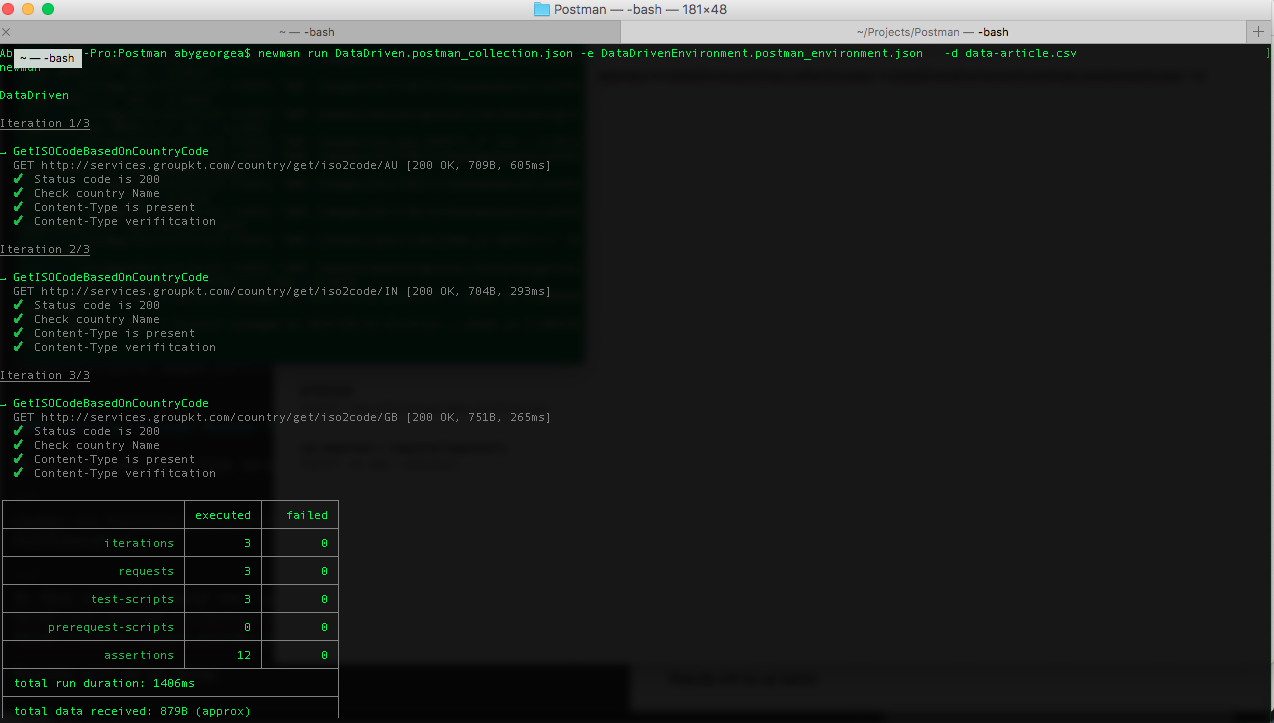
In this cases, I should run newman run DataDriven.postman_collection.json -e DataDrivenEnvironment.postman_environment.json -d data-article.csv.
Results will be as below
Running Postman Collection Using Newman
In previous blog, I explained about how to create a GET request, analyze its response, write test cases for API and to save details to a collection for future use. In this blog, let me explain about how to run collections using Newman.
What is Newman
Newman is a command line collection runner for postman. Newman also has feature parity with Postman and it runs collection in the same way how it is run through Postman. Newman also makes it easier to integrate API test case execution with other systems like Jenkins.
Installing Newman
Newman is built on Node.js and hence it requires Node.js to be installed as prerequisite. Newman can be installed from npm with below command
1
| |
Running collection using Newman
Collections are executed by calling run command in Newman. Basic command for executing collections is
1
| |
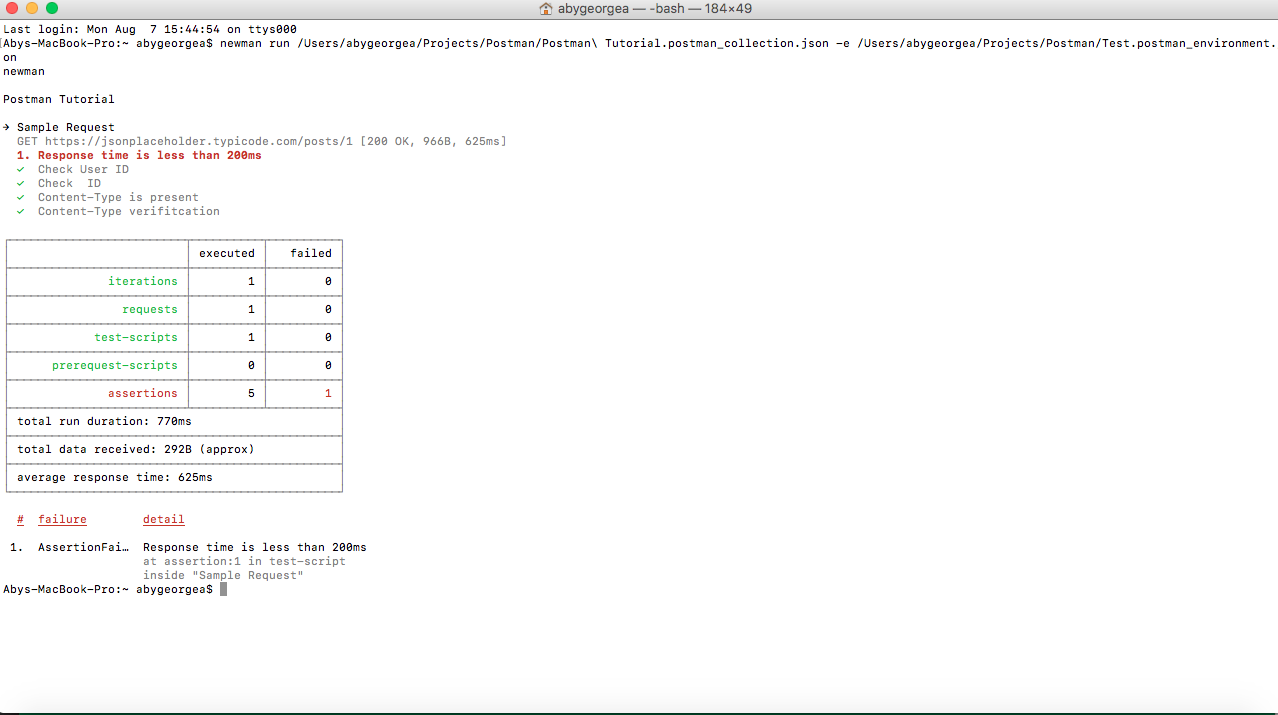
Below is an example of running collections created in previous blog post using newman.
Command will look like below
newman run /Users/abygeorgea/Projects/Postman/Postman\ Tutorial.postman_collection.json -e /Users/abygeorgea/Projects/Postman/Test.postman_environment.json
Results
The result of API test case execution will look like below. It has a detailed report of number of iterations, number of request, test scripts, pre-requisites, assertions etc. As per standard, passed ones are shown in green and failed in red. The results look similar to details provided if collections are executed using postman.
Additional Options of run command
Newman has various options to customize run. Different options can be found by running with -h flag
1
| |
Different options listed are below
1 2 3 4 5 6 7 8 9 10 11 12 13 14 15 16 17 18 19 20 21 22 23 24 25 26 27 28 29 30 31 32 33 34 35 36 37 38 39 40 41 42 43 44 45 46 47 48 49 50 51 52 53 54 55 56 57 58 59 60 61 62 63 64 65 66 67 68 69 70 71 72 73 | |
Postman Tutorial
Recently one of my colleagues has asked me to train him on using postman and Newman for API testing. Below is a cut down version of training session which I took for him.
What is Postman
Postman is an Http client for testing web services. It has a friendly GUI for constructing request and analyzing the response. There is a command line tool called Newman for running the postman collections from command line. This will help to integrate postman to other testing tools.
How to Install
Postman is available as both chrome extension and also as a native install. Native install files can be found here.
Example - GET Request
In order to trigger a get request, we need to identify below information
- URL of API
- Authentication details
- Header details
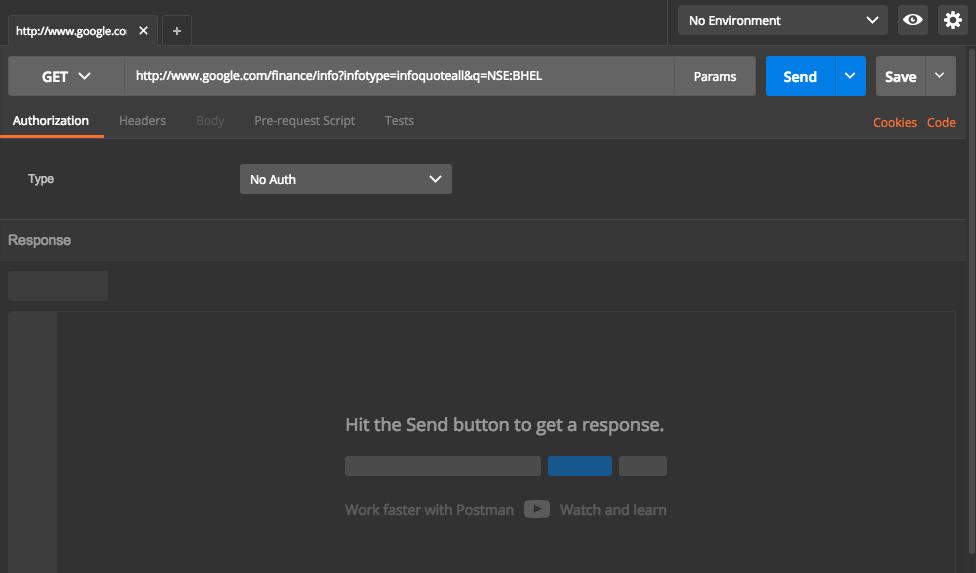
For this example, let us look at a google finance API. API URL(including parameters) is http://www.google.com/finance/info?infotype=infoquoteall&q=NSE:BHEL
There is no authentication details and header details that need to be passed with this. The params button will list down various parameters passed in a tabular format , which makes it easy to edit.
In postman, Select drop down as GET and enter the API Url. Screen will look like below
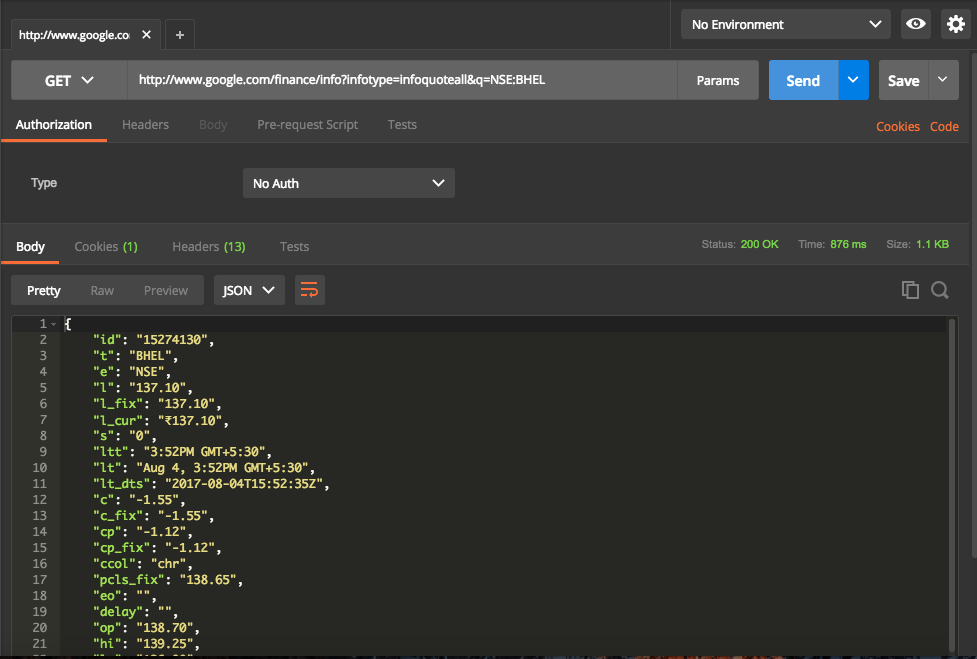
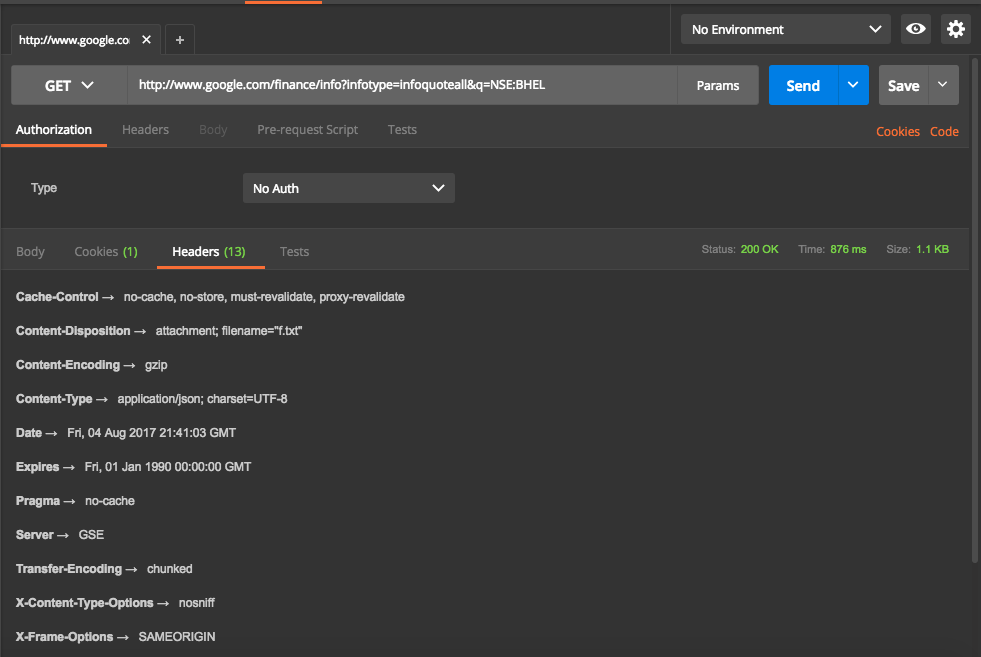
Now hit Send button. This will trigger a call to API and get the response which will then displayed in UI. Screen will look like below
Headers returned are
Writing Tests
Above is an example of calling an API and analyzing its response. Postman also has a facility to write test cases to verify the response. Test cases are written in javascript. Tests are run after the request is sent and it will allow access to response objects. The editor also provides commonly used code snippets which make it easier to write test.
The Below example is written for calling one of free API mentioned here. In this example, we have test scripts for checking status code, values in the header, values in response, response time. We can even expand the test cases to complex verifications by writing javascript tests.
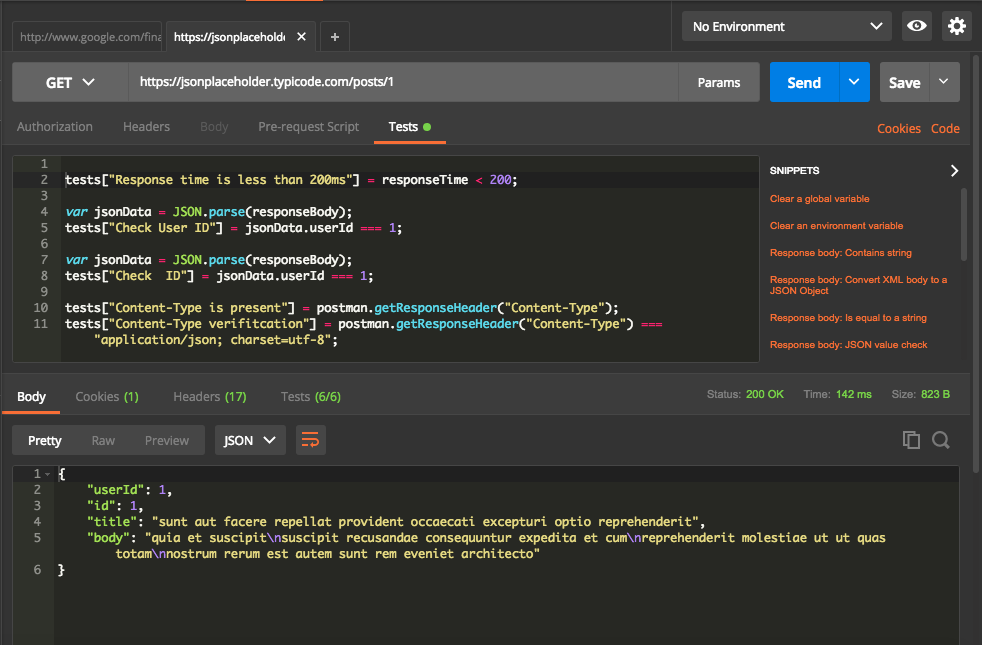
We notice following from above screenshot,
- 6 test cases written on the top part to check for the status code, response time, header and response.
- The response received on the bottom part.
- Test tab shows that 6/6 test cases are passed ( in Green).
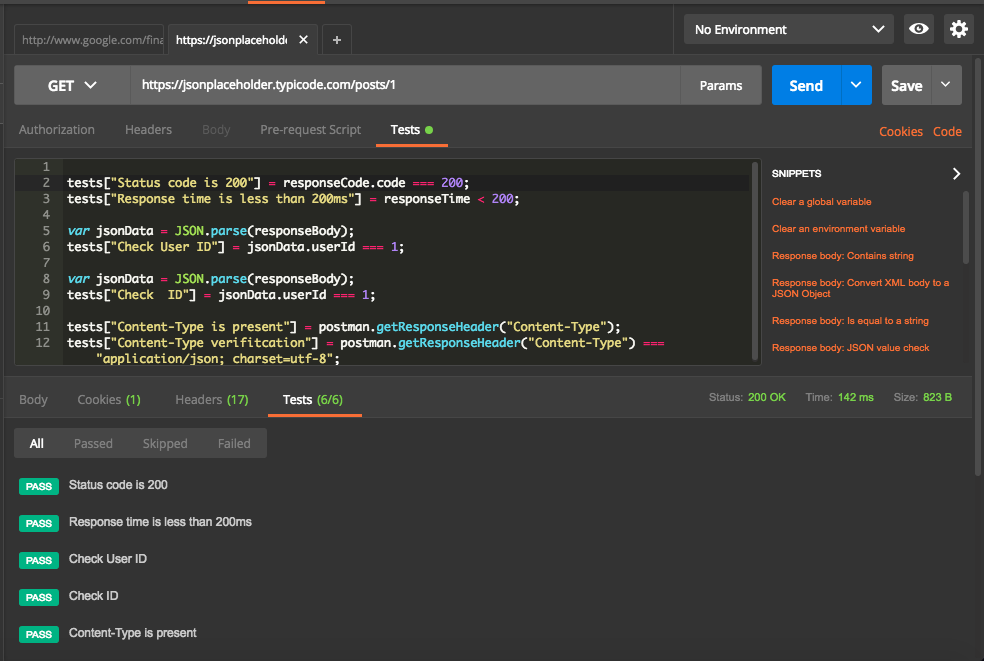
Now let us dive into details of the test results. Below screenshot shows details of test cases and their status.
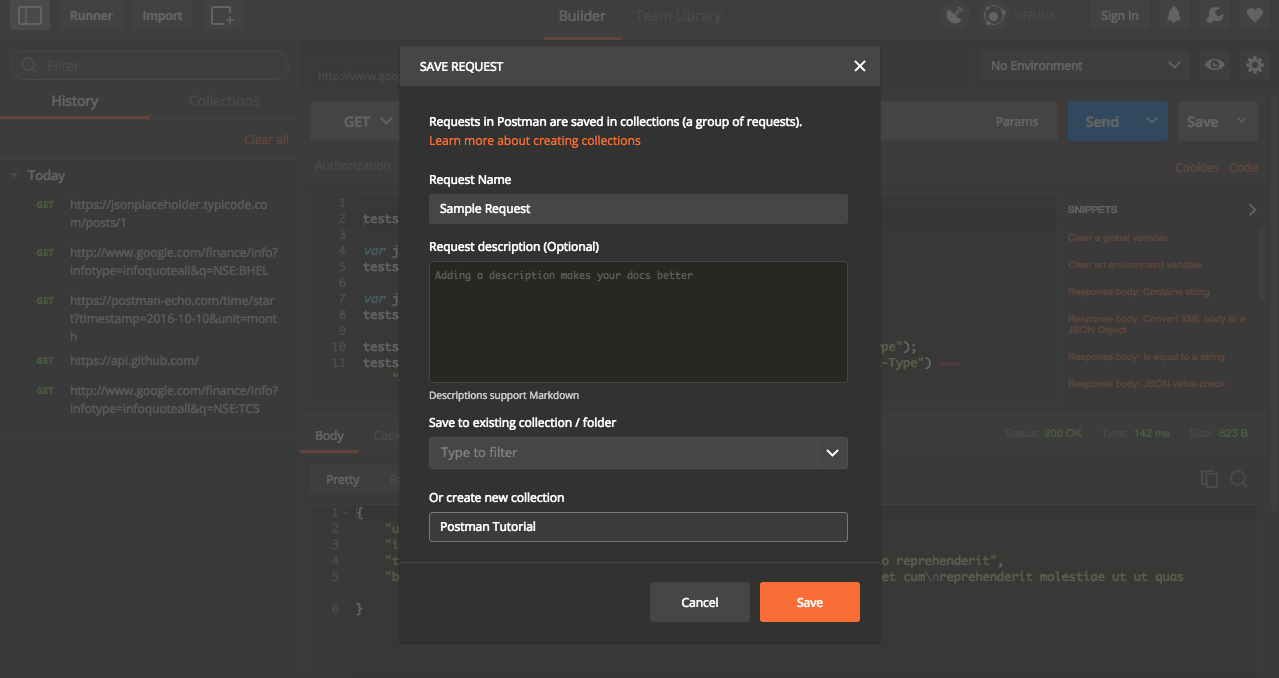
Collections
We can save the current request and it associated tests ( if any) for future use in postman. It can also be exported and shared with others. Select option as Save As from drop down next to Save. We can specify request name, provide a description and select a folder and sub folder to save the response.
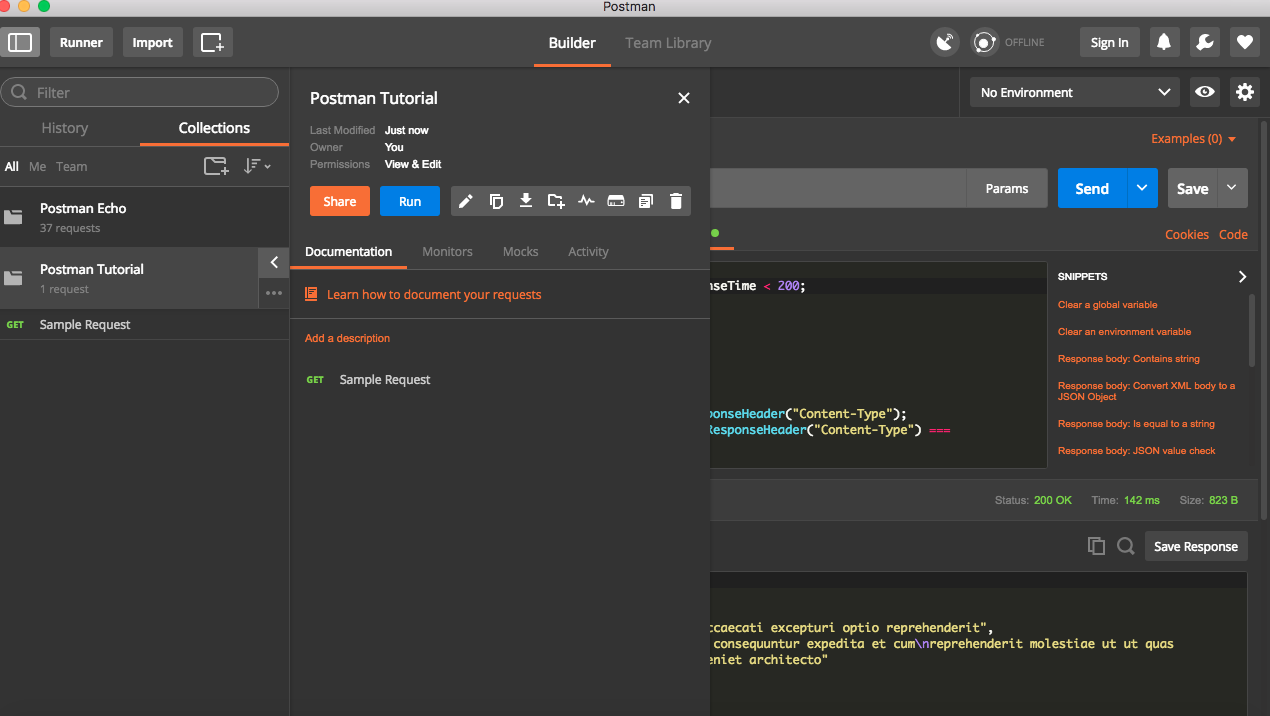
Once saved, it will be available for use in collections.
Environments
Very frequently, we will have to run API test in different environments. Most of the time, there will be few differences in the requests, like different URL. In such cases, we can use environments in Postman.
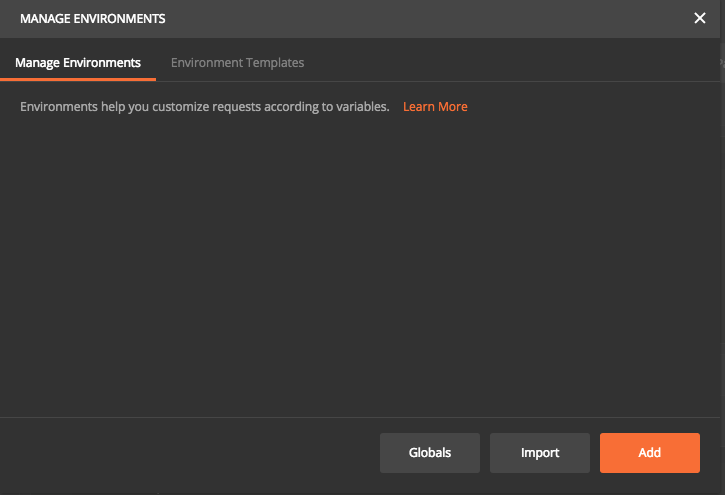
Click on the Settings button on top right corner and select Manage environments. This is open up a new pop up where we can add Environment or import an existing environment file. For this tutorial, we will use Add option.
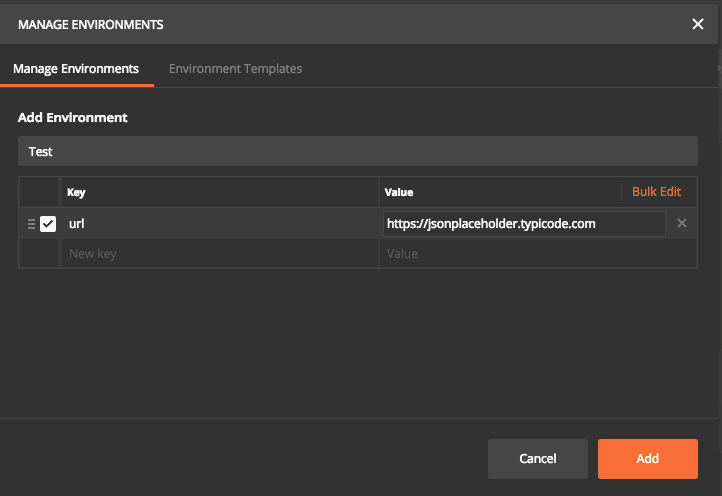
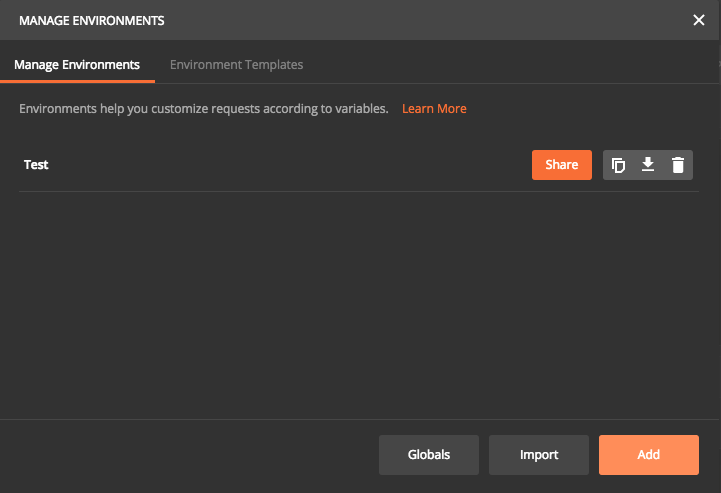
Now we can specify all unique parameter for each environment. In this case, I have given a key called “URL” and entered corresponding values and saved it as an environment named Test.
Now let us run the request using environments. First step is to replace https://jsonplaceholder.typicode.com with url in double curly braces. Then select Test in the Environment drop down at the top. Now click send. This will execute the request and run all associated test cases. Postman will dynamically replace with corresponding URL value specified in selected environment file. So assuming we have different environment files, each time the request will be sent to different URL based on environment selected. We can have any number of keys and values in one environment file.
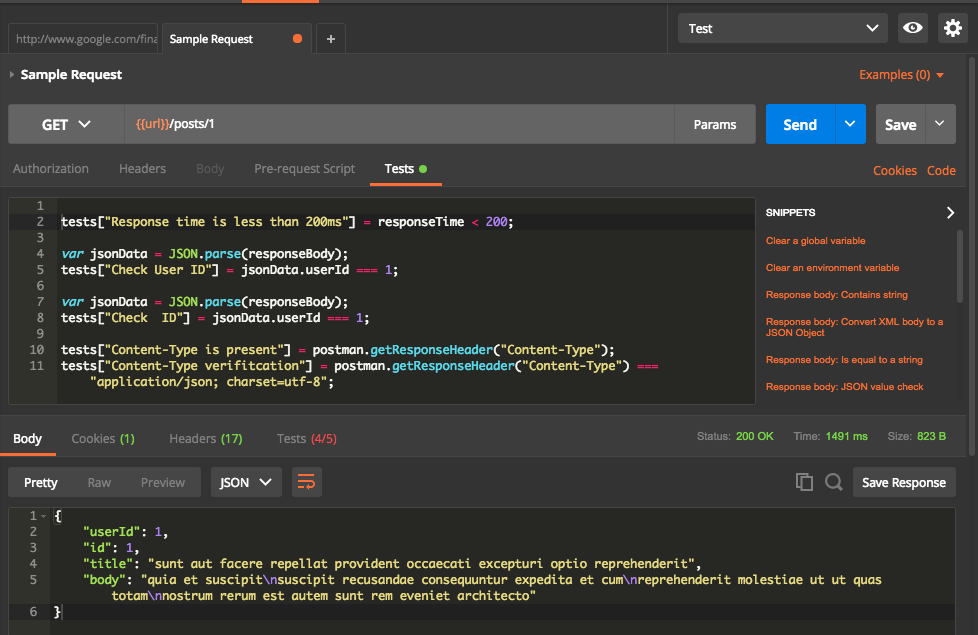
From above, we can see that one test case is failed. Let us have a look into failed test case.
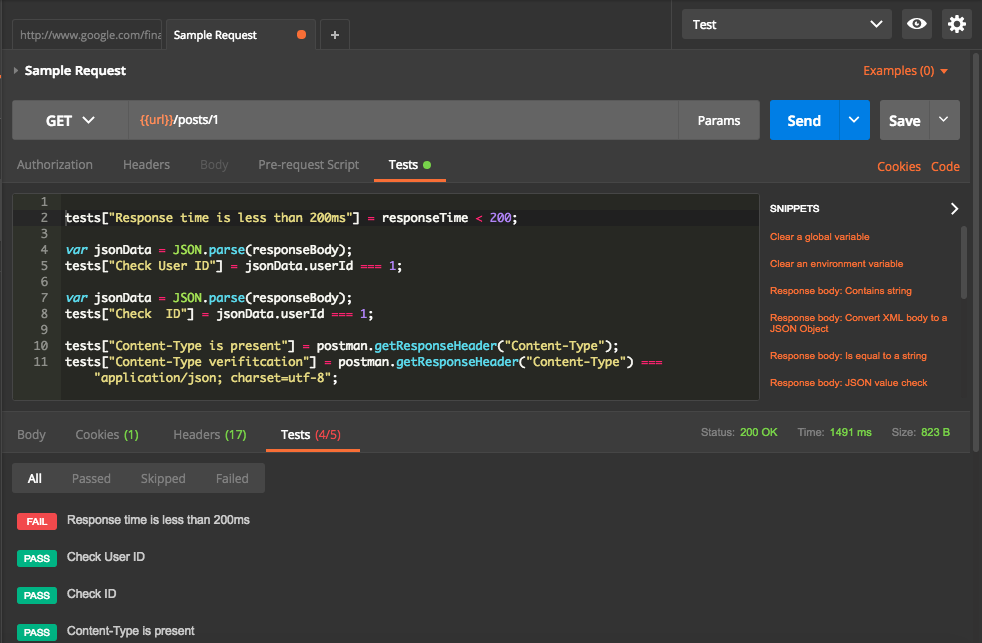
Failed test case is for the time taken for the response. Current request took 1491 ms which is higher than expected 200ms.
Exporting Collections and environment files
Postman provides facility to export collections and environment files as JSON. This helps to share the details with other team members and also to use Newman for running postman collections. Let us have a look into how to export them.
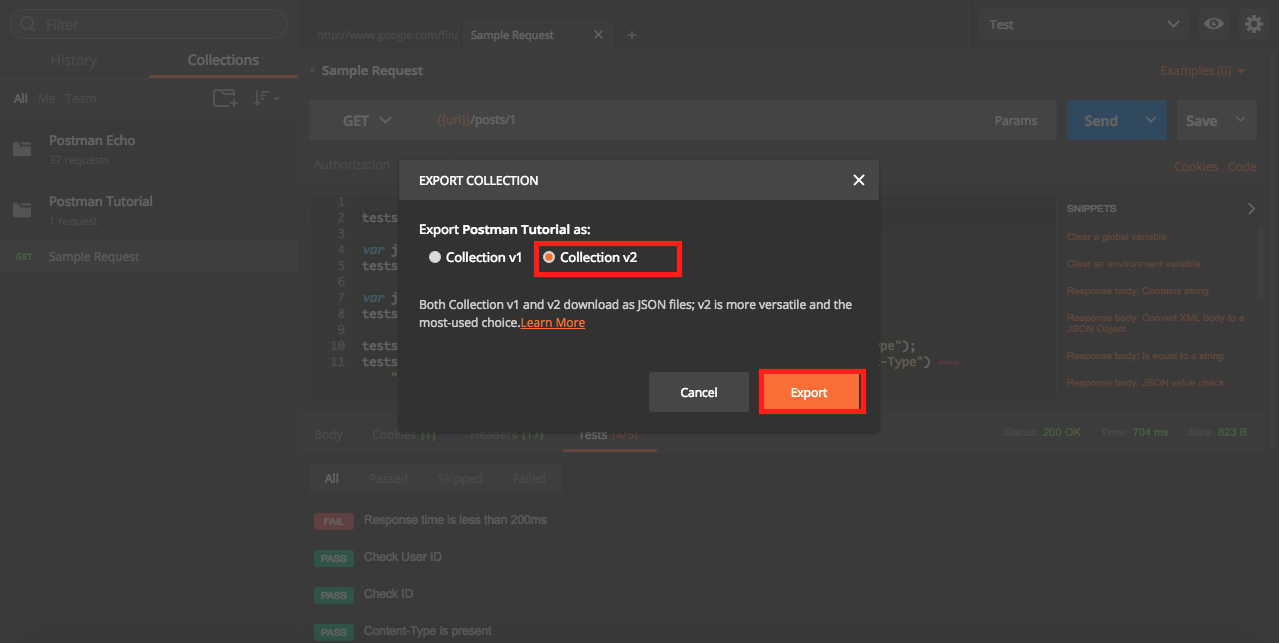
Exporting Collections
- Click on Collections Tab.
- Click on
...next to Collections Name. - Click on Export.
Select V2 option and save the file.

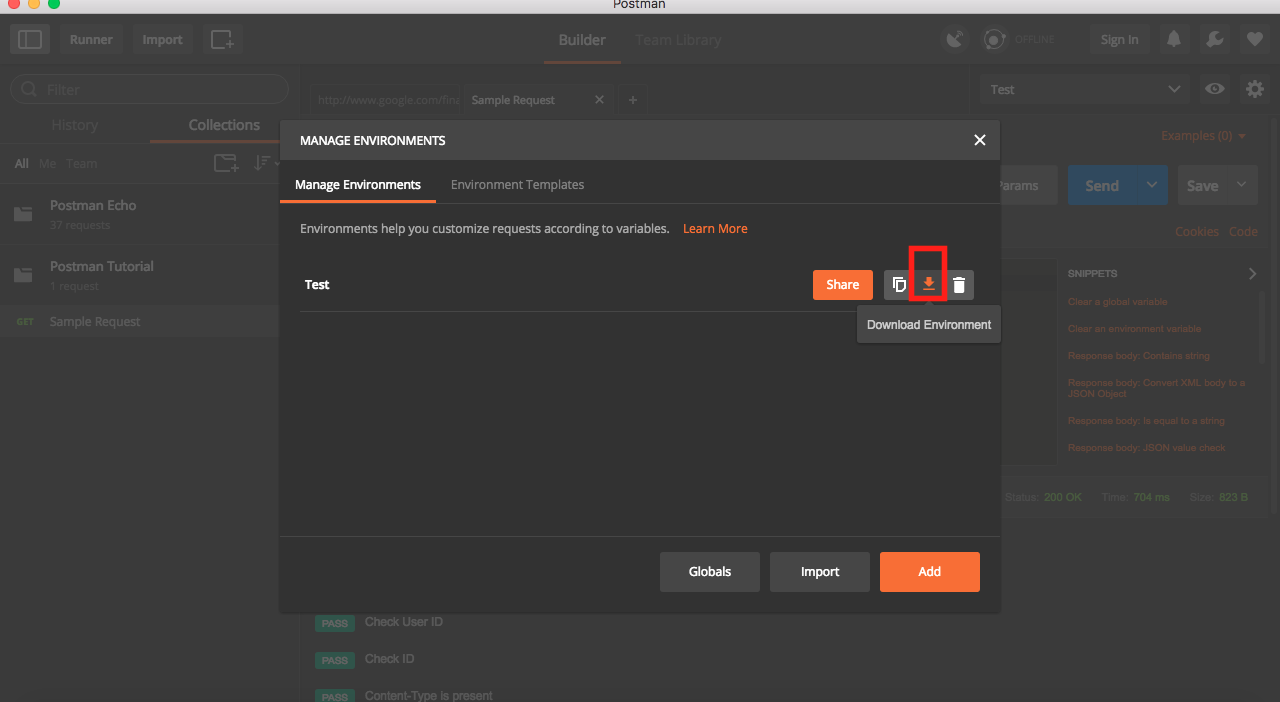
Exporting Environment File
- Click on Settings button on top right corner.
- Click on Manage environment.
Download the file.
Running Collections Using Postman Collection Runner
Postman provides a feature to run collections using collection Runner.
- Click on Runner button on Top left to open collection runner
Select Collection name in drop down and select environment and then hit
Start Run.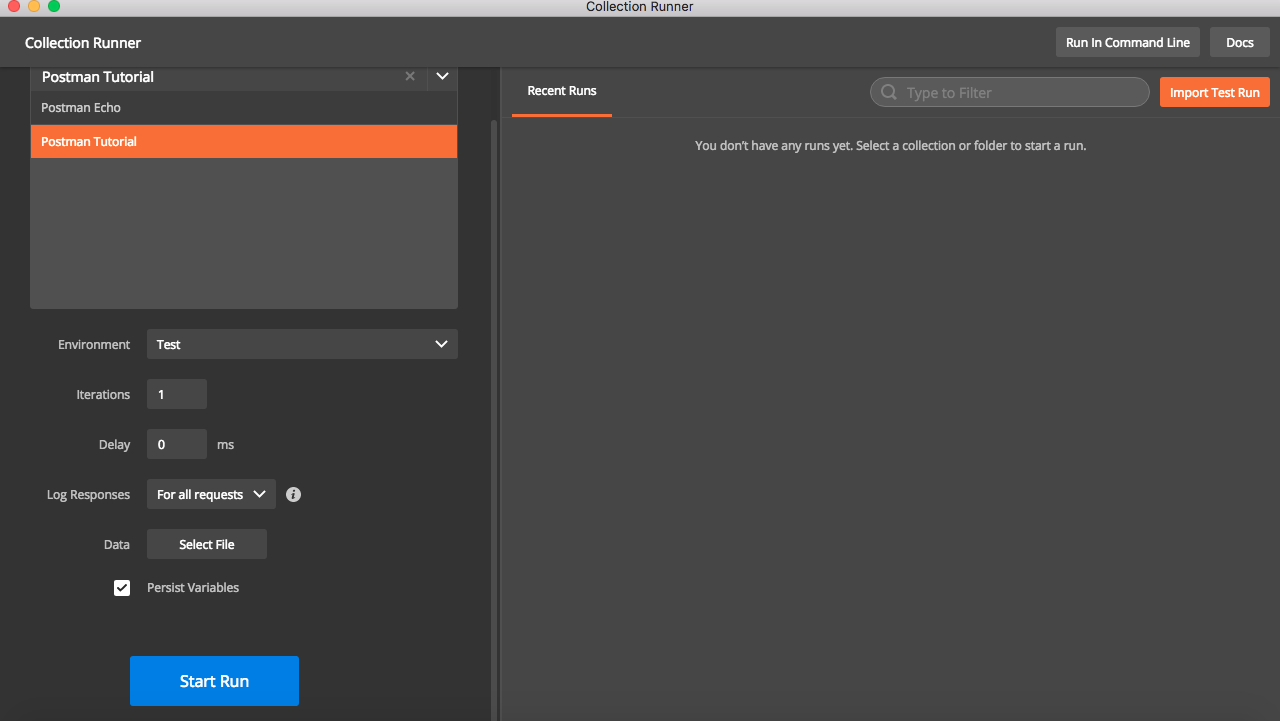
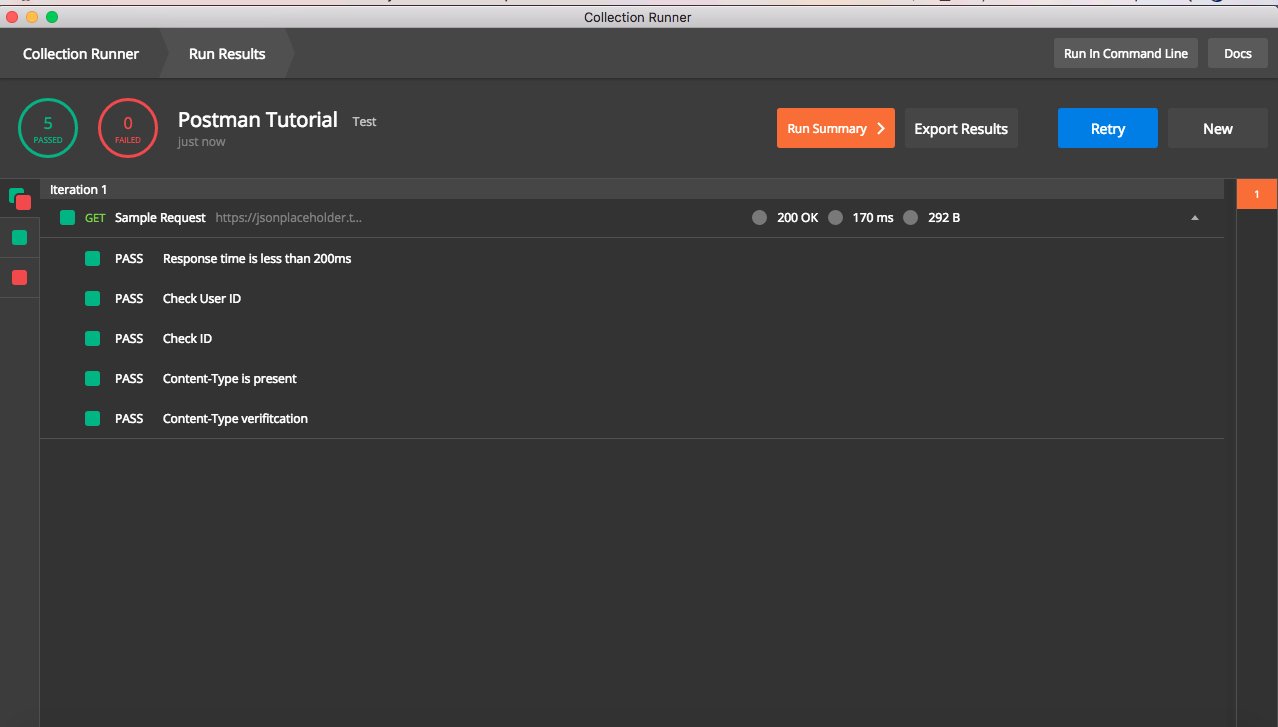
This will trigger execution of request and test cases mentioned in collection and results will be shown. Also note that collection runner has additional options like number of iteration, delay before sending request , input from data file etc .
Once execution is complete, result will be shown like below. It will have details of all assertions done and options to export results for future verification.
What Next ?
In this post, I have explain basic usage of postman for API testing . However the functionalities provided by postman is much more than above. We can also use Newman , which is command line collection runner , to execute collections. I will write another post about it sometime soon.